


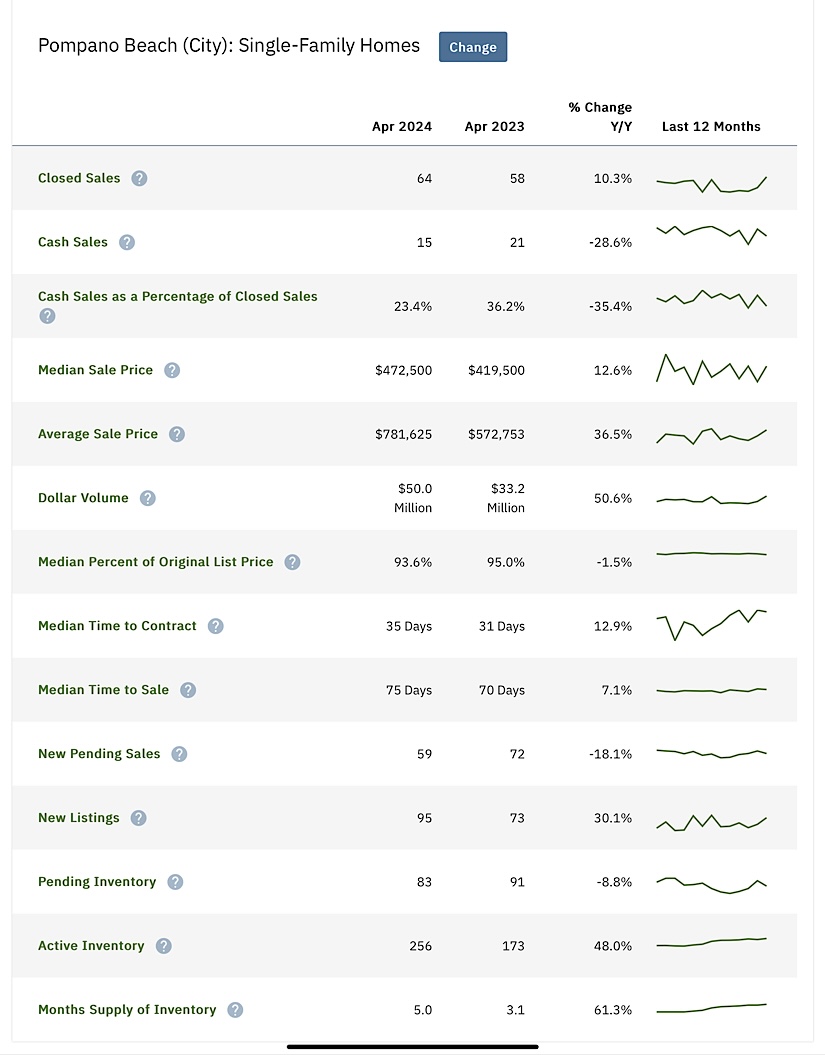
Pompano Beach Real Estate Market Report April 2023 compared to April 2024
This Pompano Beach Real Estate Market Report provides a comprehensive overview of the housing market trends for Pompano Beach Single-Family Homes for April 2024. It includes various metrics comparing April 2024 with April 2023, along with insights from the last 12 months.
Key Metrics and Trends:
1. Closed Sales
– Apr 2024: 24
– Apr 2023: 33
– % Change Y/Y: -27.3%
– Trend: There has been a significant decrease in the number of closed sales by 27.3% compared to the previous year.
2. Cash Sales
– Apr 2024: 5
– Apr 2023: 7
– % Change Y/Y: -28.6%
– Trend: Cash sales have also decreased by 28.6%.
3. Cash Sales as a Percentage of Closed Sales
– Apr 2024: 23.4%
– Apr 2023: 21.2%
– % Change Y/Y: 10.4%
– Trend: The percentage of cash sales in relation to closed sales has increased by 10.4%.
4. Median Sale Price
– Apr 2024: $670,000
– Apr 2023: $775,000
– % Change Y/Y: -13.5%
– Trend: There has been a decrease in the median sale price by 13.5%.
5. Average Sale Price
– Apr 2024: $1,004,167
– Apr 2023: $1,167,375
– % Change Y/Y: -14.0%
– Trend: The average sale price has dropped by 14%.
6. Dollar Volume
– Apr 2024: $24.1 Million
– Apr 2023: $38.5 Million
– % Change Y/Y: -37.3%
– Trend: There is a substantial decline in the total dollar volume of sales, down by 37.3%.
7. Median Percent of Original List Price Received
– Apr 2024: 96.1%
– Apr 2023: 98.7%
– % Change Y/Y: -2.6%
– Trend: Homes are selling closer to the original list price, but there is a slight decrease of 2.6%.
8. Median Time to Contract
– Apr 2024: 46 Days
– Apr 2023: 25 Days
– % Change Y/Y: 84.0%
– Trend: The median time to contract has increased significantly by 84%.
9. Median Time to Sale
– Apr 2024: 79 Days
– Apr 2023: 70 Days
– % Change Y/Y: 12.9%
– Trend: The median time to sale has increased by 12.9%.
10. New Pending Sales
– Apr 2024: 29
– Apr 2023: 35
– % Change Y/Y: -17.1%
– Trend: There is a decrease in new pending sales by 17.1%.
11. Pending Inventory
– Apr 2024: 37
– Apr 2023: 51
– % Change Y/Y: -27.5%
– Trend: The pending inventory has decreased by 27.5%.
12. Inventory (Active Listings)
– Apr 2024: 115
– Apr 2023: 78
– % Change Y/Y: 47.4%
– Trend: There has been a significant increase in inventory by 47.4%.
13. Months Supply of Inventory
– Apr 2024: 5.0
– Apr 2023: 3.4
– % Change Y/Y: 48.0%
– Trend: The months’ supply of inventory has increased by 48%.
Summary
The housing market for single-family homes in Pompano Beach experienced notable changes in April 2024 compared to April 2023. Key trends include a significant reduction in closed sales, down by 27.3%, and cash sales, which fell by 28.6%. The median sale price for Single Family Homes in Pompano Beach decreased by 13.5% to $670,000, while the average sale price dropped by 14% to $1,004,167. The total dollar volume of sales saw a substantial decline of 37.3%.
Homes in Pompano Beach, FL are selling closer to their original list prices, but there is a slight decrease of 2.6% in the median percent of original list price received. The median time to contract increased dramatically by 84% to 46 days, and the median time to sale rose by 12.9% to 79 days. New pending sales decreased by 17.1%, and pending inventory fell by 27.5%.
On the other hand, active inventory increased significantly by 47.4%, and the months’ supply of inventory rose by 48% to 5.0 months. These trends suggest a cooling market with longer selling times and increased inventory, potentially indicating a shift towards a buyer’s market.
Call a Pompano Beach Real Estate agent at 954-505-6000 to either list your Pompano Beach Home For Sale or to buy a home in Pompano Beach.
View the 60 latest Single Famioly Homes For Sale in Pompano Beach


